Why profiling at all?
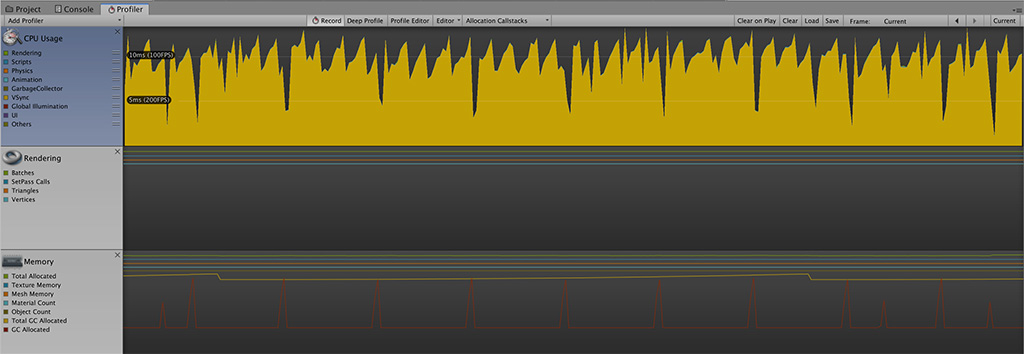
Profiling is one of the most important tasks you have to do in game development. As Robert C. Martin tells us it is not enough for our code to just work. Our code also needs to be efficient. No one likes a game or any app that 'works' but runs at 3 FPS or wastes memory.
"It is not enough for code to work."
Fortunately we can choose between a bunch of profilers. Unity ships with an integrated profiler and
for iOS you can make use of Xcode Intruments. Unity's profiler is already really useful and will
help you a lot in finding hotspots.
But what if you need more detailed profiling data than what Unity provides or how can you profile a Unity build that is not a development build? In these cases you can profile your app from within Xcode by making use of Xcode Instruments.
Xcode Instruments
Xcode Instruments collects huge amounts of data while profiling and lets you inspect all details you are interested in. The downside here is that there's no correlation to any Unity events because you only see the raw profiling data and you will have a hard time finding out what happens in your game when investigating a hotspot. Below you can see a single allocation from within the GfxDeviceWorker thread, allocating around 8MB. Without anymore contextual data it is not so easy to find out which asset used so much memory.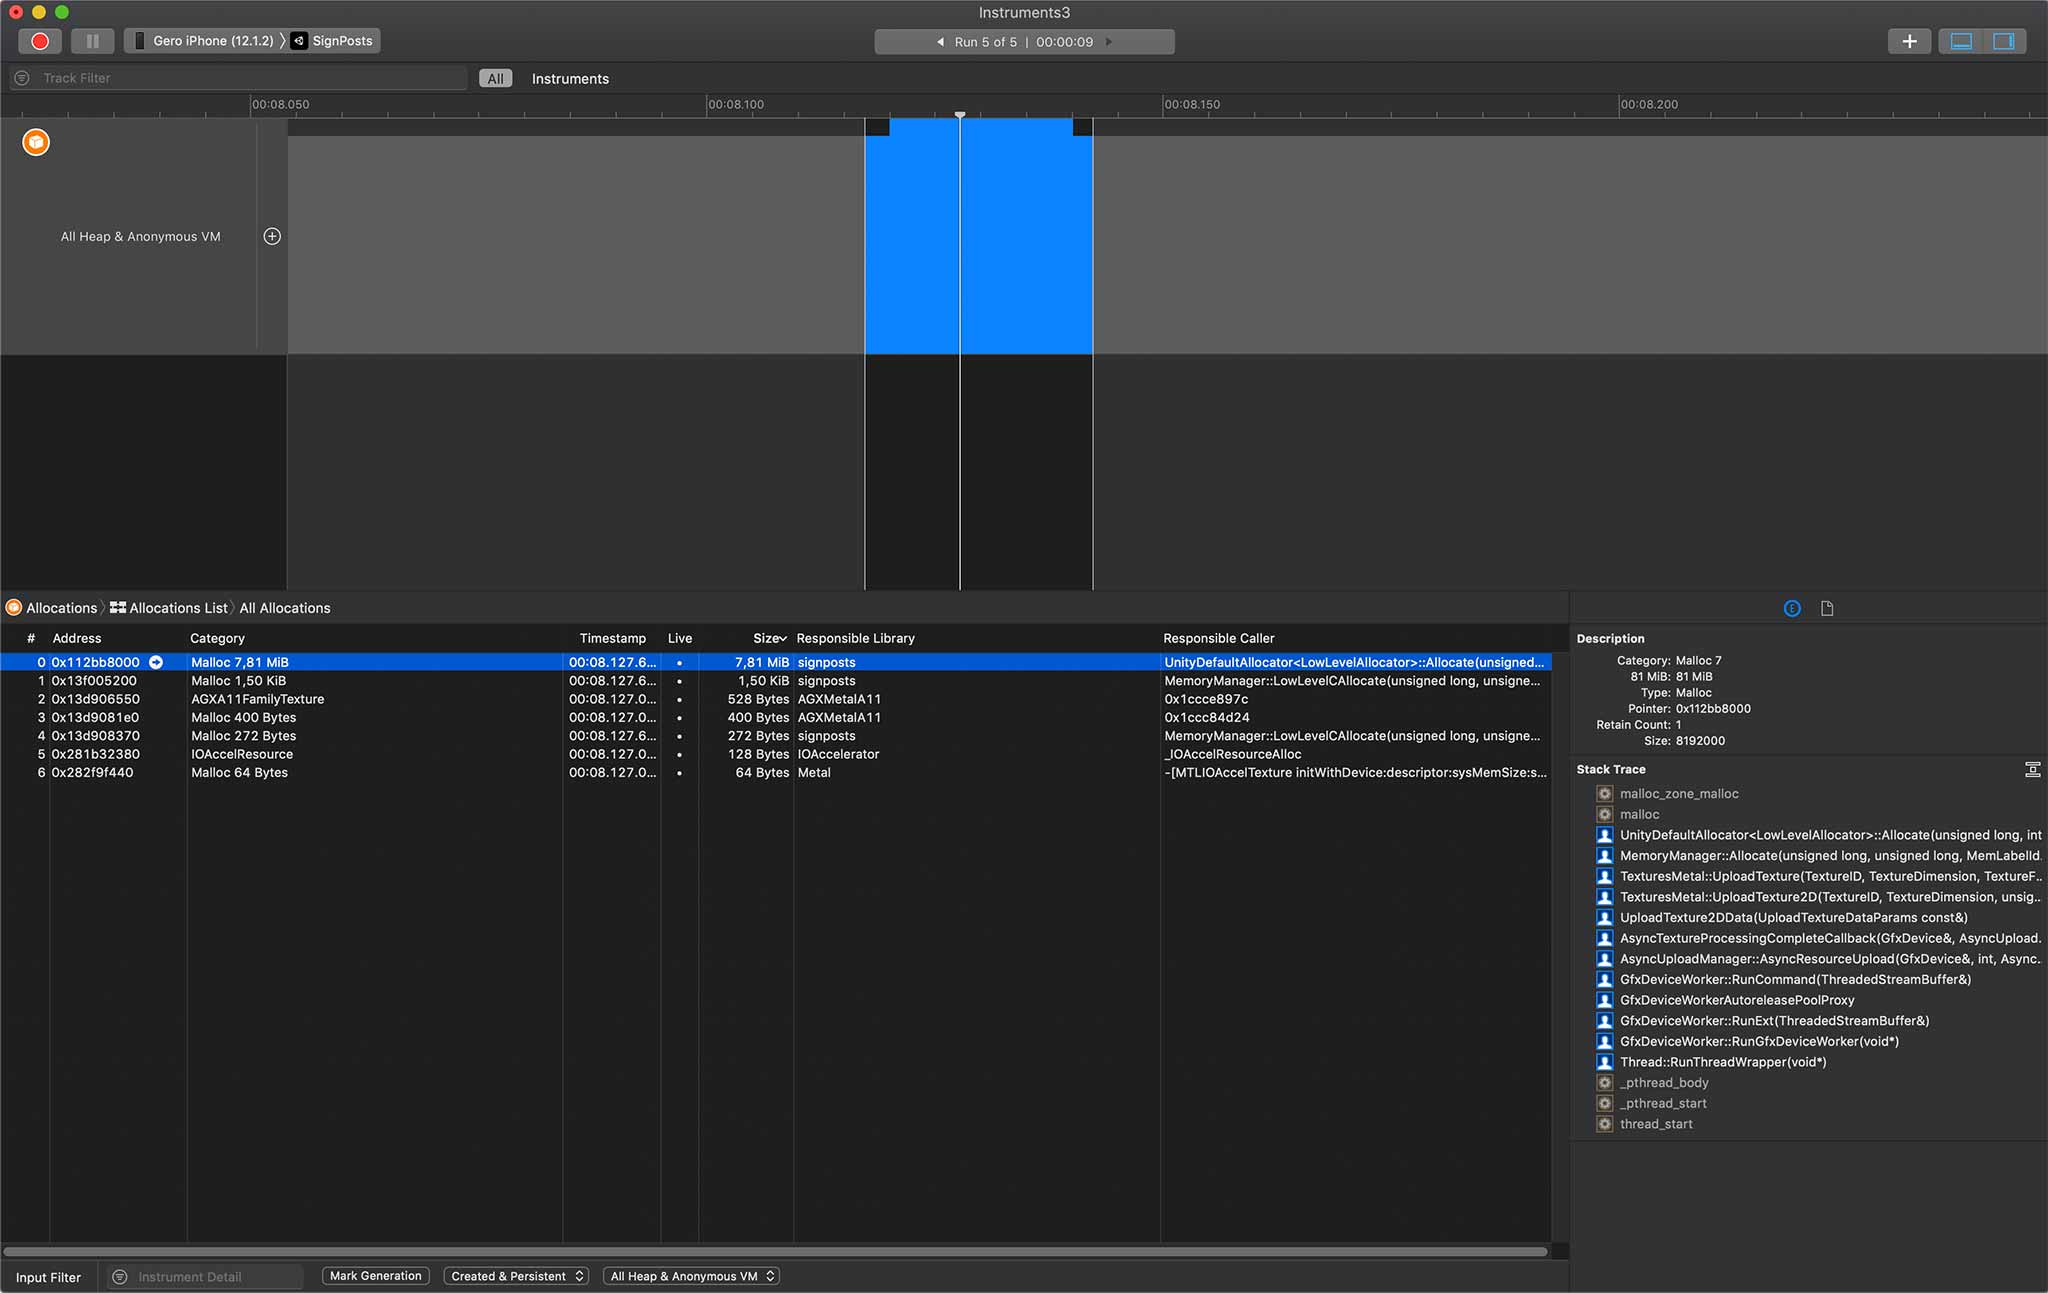
os_signposts
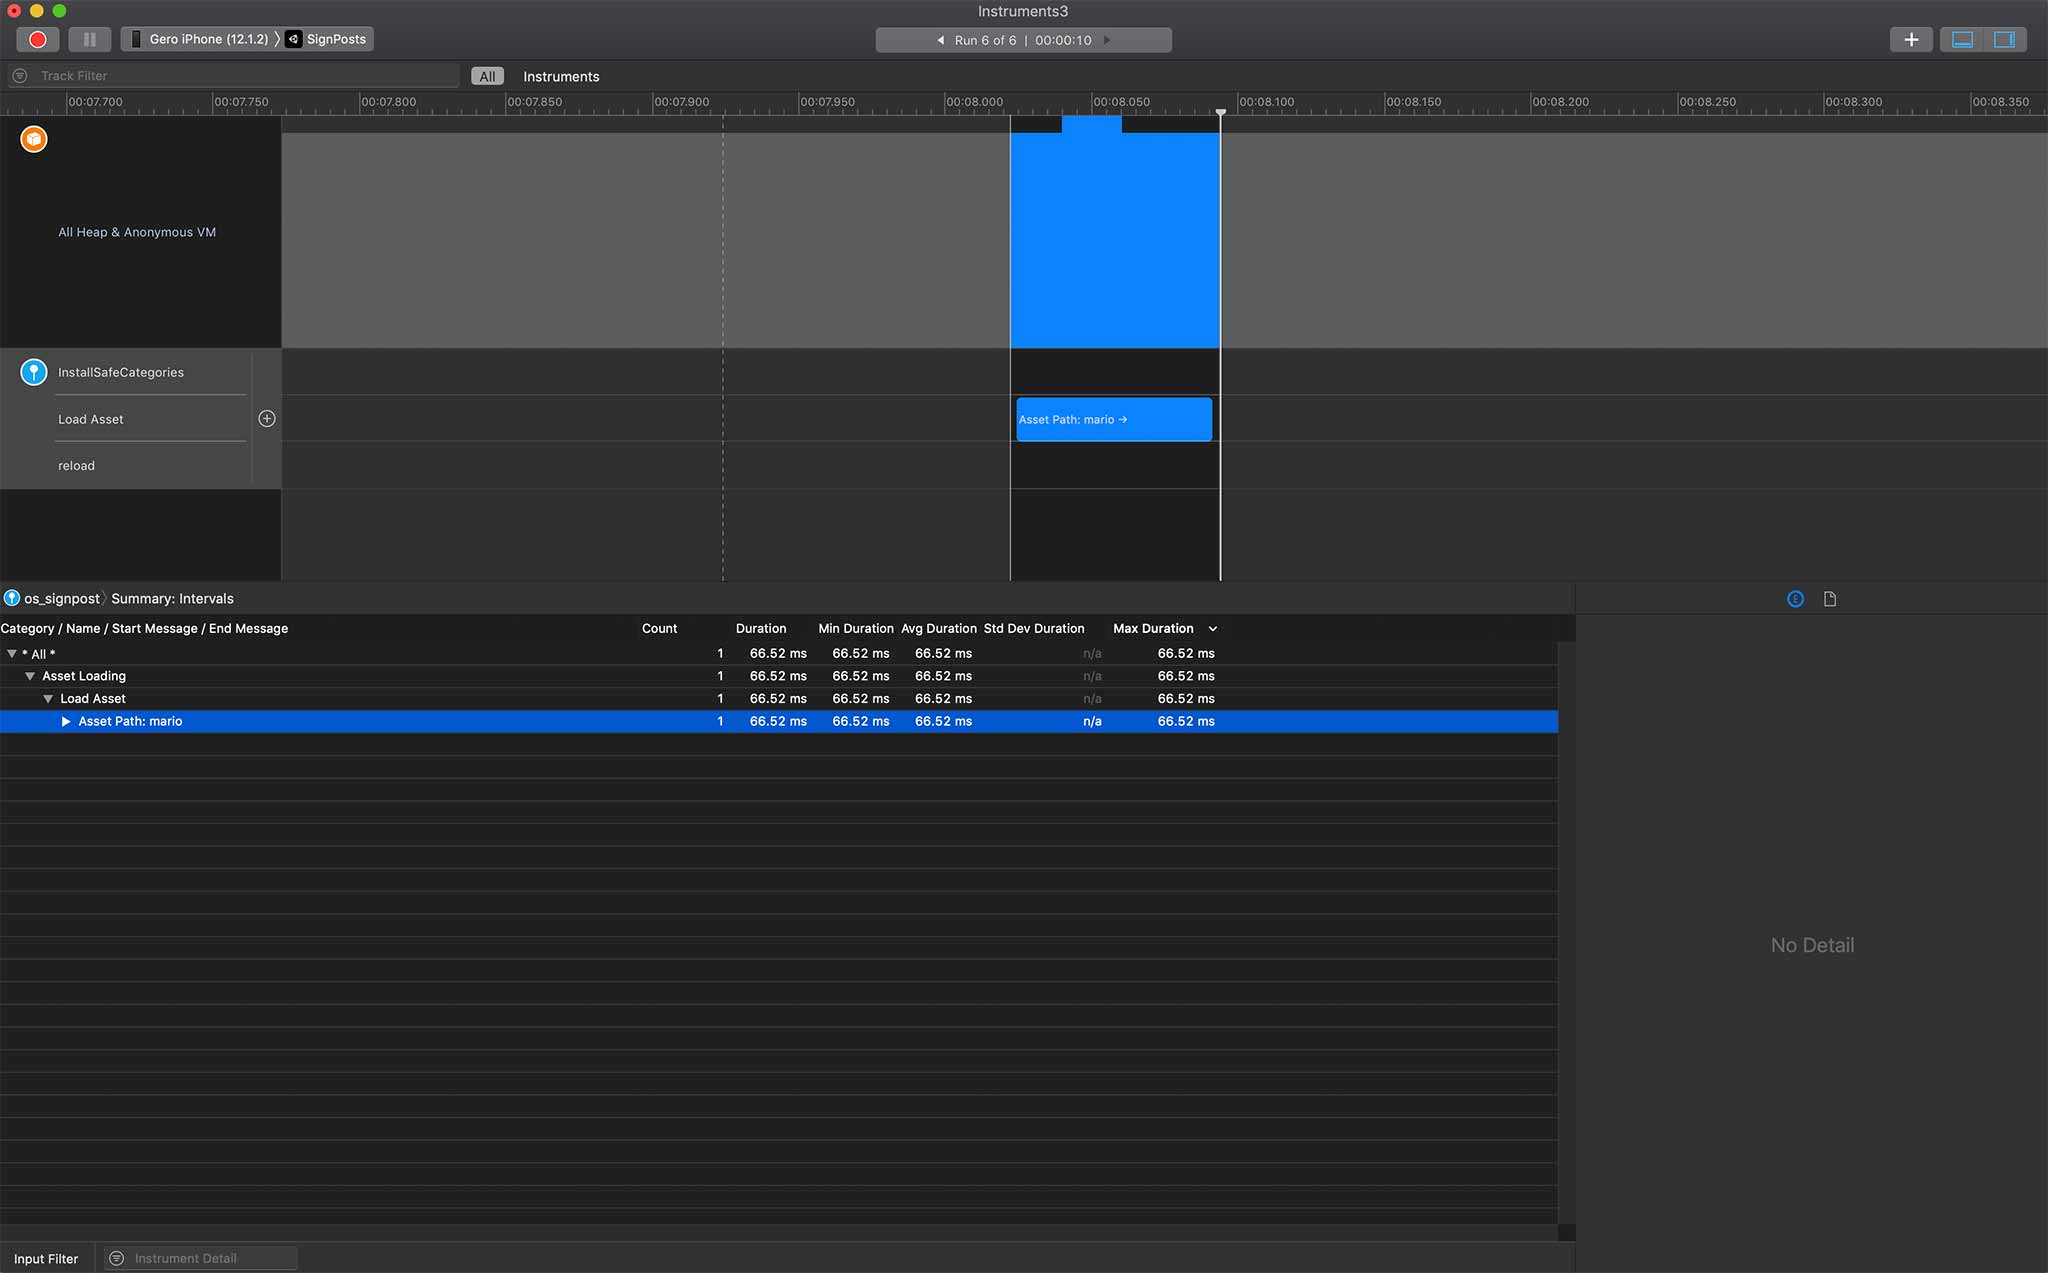
Lucky us Apple provides us with an API that lets us inject custom markers (aka signposts) in Xcode Instruments. Those signposts give us the ability to add more app-specific context to the profiling data. Those signposts come in two categories: events and intervals . Events stand for a single action in your application with no duration. A good example might be a user's tap event. Intervals on the other side have a corresponding begin and end function. Xcode Instruments measures the time between those calls so you get information about how long an interval lasts. One example for an interval in your app might be loading an asset or a scene.Signposts are part of the os Framework and available with iOS 12+. In order to make singposts work in Unity we have to create a native iOS plugin. Once this plugin is in place we can get much more detailed data which we can then correlate to other performance metrics in Instruments. In the screenshot below we added an interval around the call to UnityEngine.Resources.LoadAsync<Sprite>. Because loading the asset takes some time we see 1) how long it takes to load the asset and 2) we can assume that the allocation is being triggered because of the fact we do load an asset and 3) we see the asset path ('mario') in the signpost's metadata.
Creating the Unity plugin
So first of all we need to create a native iOS plugin in order to call the os Framework functions from there. Unfortunately Apple forces us to use string literals for some of the parameters of the os_signposts methods. That way we can not make the interface as generic as we would like to but we have to add some more methods than I actually would like to.These methods now enable us to create their corresponding stub functions on C# side. This is straightforward and not any different to other native iOS plugins.
Start using signposts in Unity
With those functions in place we can now actually connect them to our code and insert them in the correct spots. First we will wrap the above mentioned call to UnityEngine.Resources.LoadAsync<Sprite>. It is probably best when you wrap calls for asset or scene loading inside your own functions. This way you only need to insert the signpost code in one place and not all over your codebase.Here we start a coroutine that loads the needed asset async. Just before initializing the load we do call start_interval_load_asset with the asset name as the parameter. Very important here is that we store the signpost-id because we have to use this unique id to stop the interval, right after the asset finished loading via stop_interval_load_asset.
Signposts are lightweight objects and you can trigger a lot of them without any impact on your performance. When connected to Instruments you should make sure that you do not record in Immediate mode. This way Instruments does not try to process and display all the events in realtime.
Points of Interest
Once you have lots and lots of signpost events you might want to highlight specific events in Instruments. Therefore Apple added the Points of Interest instrument. Here you should only display events/intervals that are key to your application. In order to utilize the Points of Interest instrument for a signpost the signpost-id needs to be created on a log-handle with category OS_LOG_CATEGORY_POINTS_OF_INTEREST. As you can see above the function event_input_tap already makes use of this category.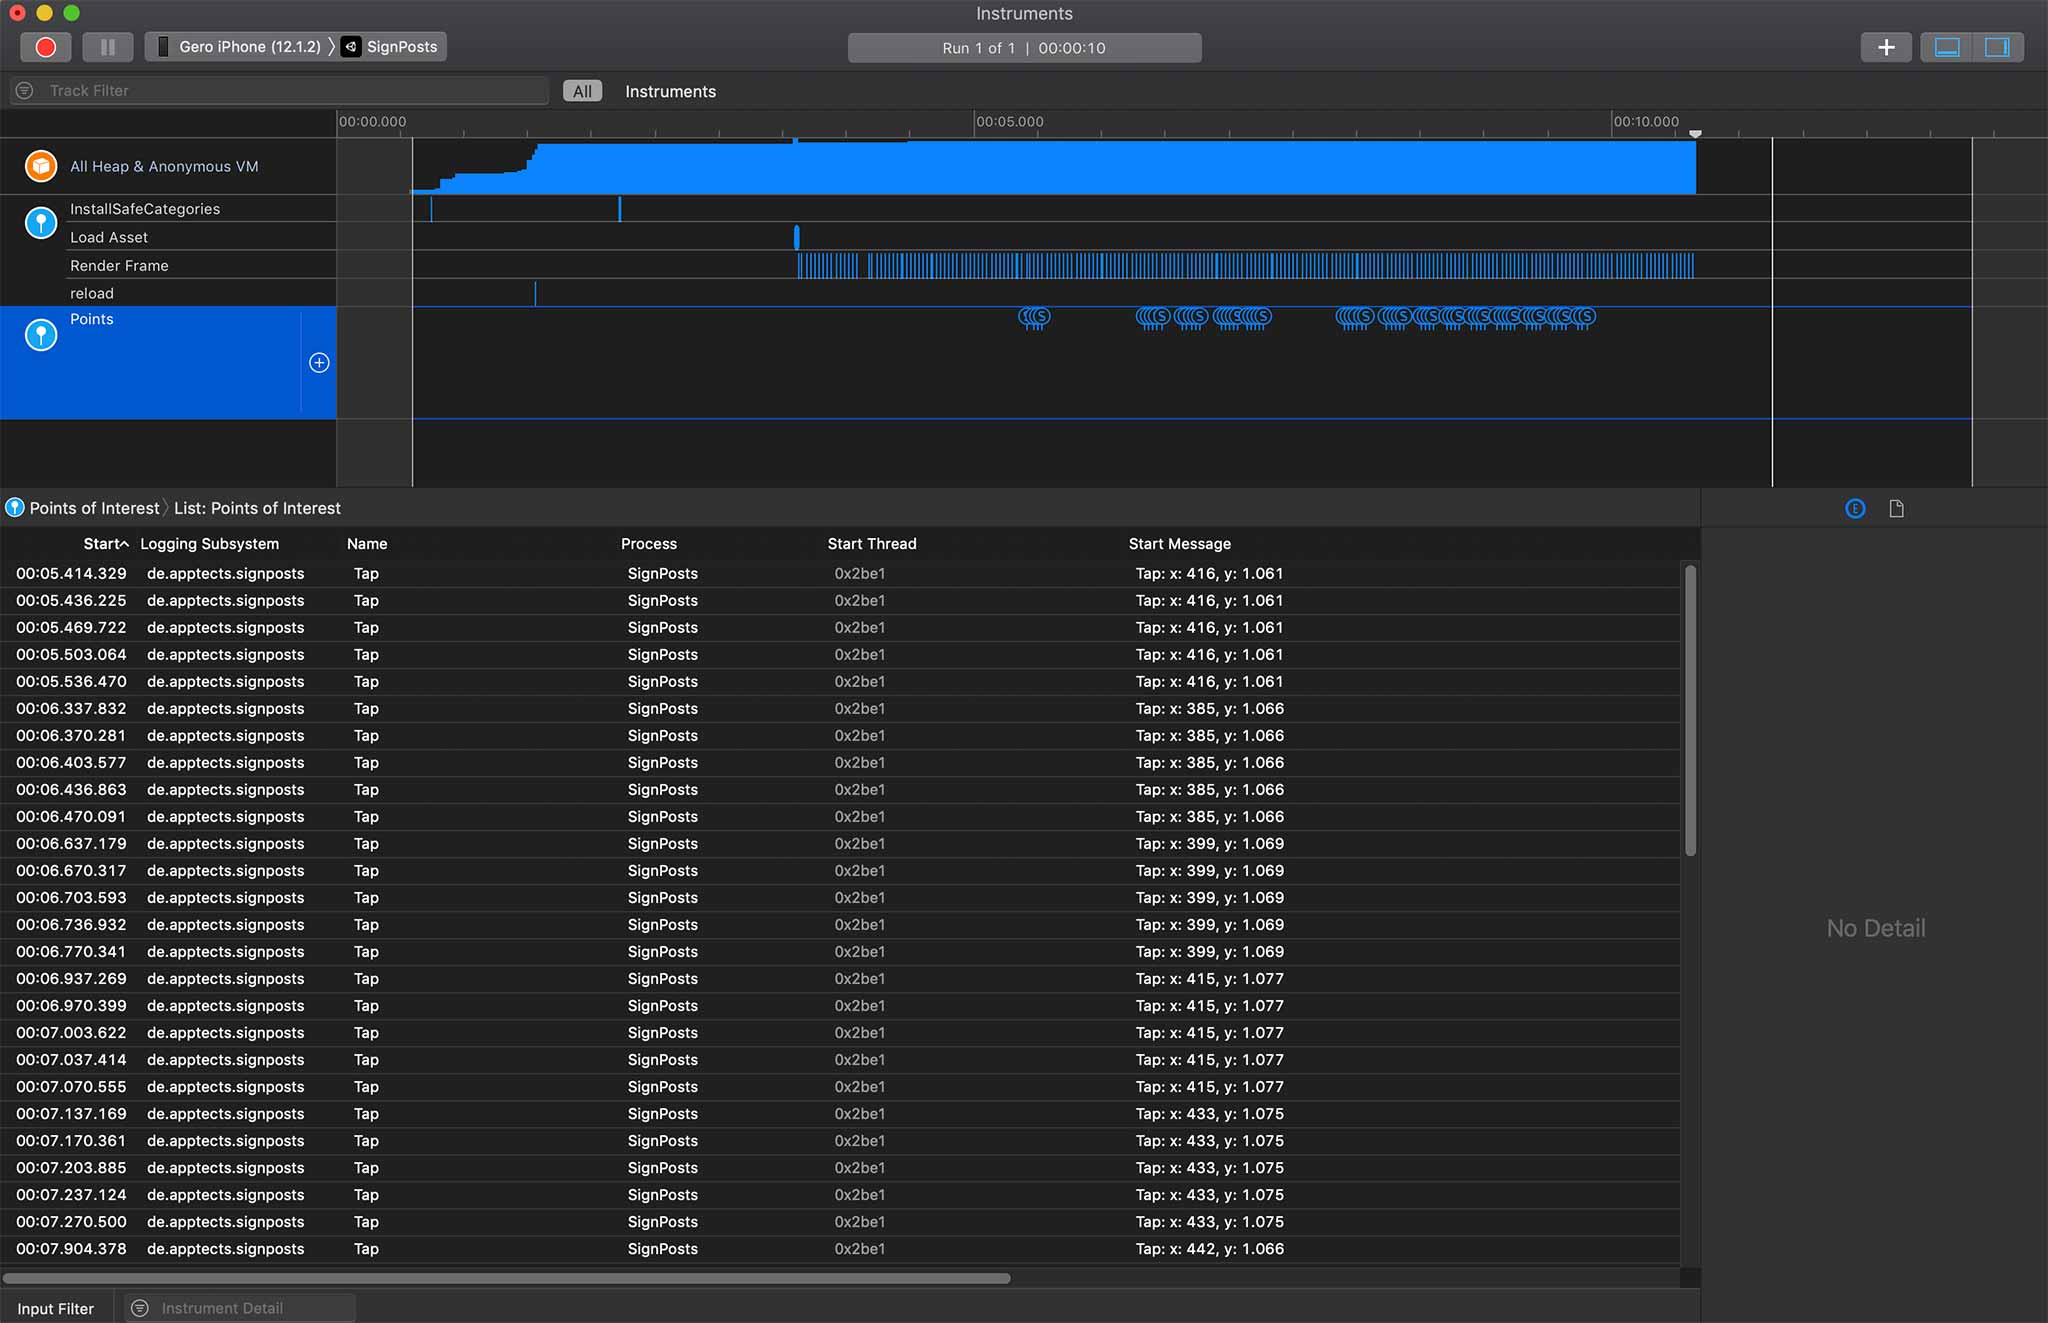
Conclusion
os_signposts are a great tool for profiling your app. Even together with Unity it is not that much of work to integrate this functionality. What I am actually missing is that you do not get any callstack information for signposts. At times where you can see a callstack for every single allocation it should be not a big problem to add this from Apple side.Thank you for reading my first blog post. If you enjoyed it please share my post or connect via Twitter or Instagram. 🤓